Study on Tariffs:

This report is an extension of an earlier study on tariffs released by the APEC Policy Support Unit in 2019, as part of the Free Trade Area of the Asia-Pacific (FTAAP) Work Programme on Tariffs. This earlier study, among other things, examined market access commitments within one of the possible pathways to FTAAP - the Comprehensive and Progressive Agreement for Trans-Pacific Partnership (CPTPP). Another possible FTAAP pathway, the Regional Comprehensive Economic Partnership (RCEP), was signed on 15 November 2020, motivating the realization of this study, which should provide a similar assessment of market access commitments.
Both the CPTPP and RCEP are important pathways for FTAAP because they strengthen economic links among their members (e.g., increased market access and greater economic integration across the region) and represent important instruments to build up trust among economies. RCEP, for instance, represents almost a decade of important trust building amid the absence of bilateral free trade agreements (FTAs) between some economies, when negotiations started. This report focuses exclusively on analyzing one aspect of RCEP: tariff liberalization schedules. The findings show that, from the tariff liberalization perspective, RCEP is an important step forward to realize the creation of the much larger FTAAP.
The FTAAP envisions to integrate trade in APEC and, thus far, RCEP will strengthen links among 12 member economies, while the CPTPP links 11 member economies. Australia; Brunei Darussalam; Japan; Malaysia; New Zealand; Singapore; and Viet Nam would likely benefit more from these agreements compared to other APEC member economies since they are parties to both the CPTPP and RCEP. On the other hand, Hong Kong, China; Papua New Guinea; Russia; Chinese Taipei; and the United States remain outside of both.

RCEP is the largest regional FTA in the world. Its potential is huge as its 15 members account for about 2.2 billion people (30% of the global population), a regional gross domestic product (GDP) of about USD38,813 billion (30% of global GDP), and 28.8% of global trade.
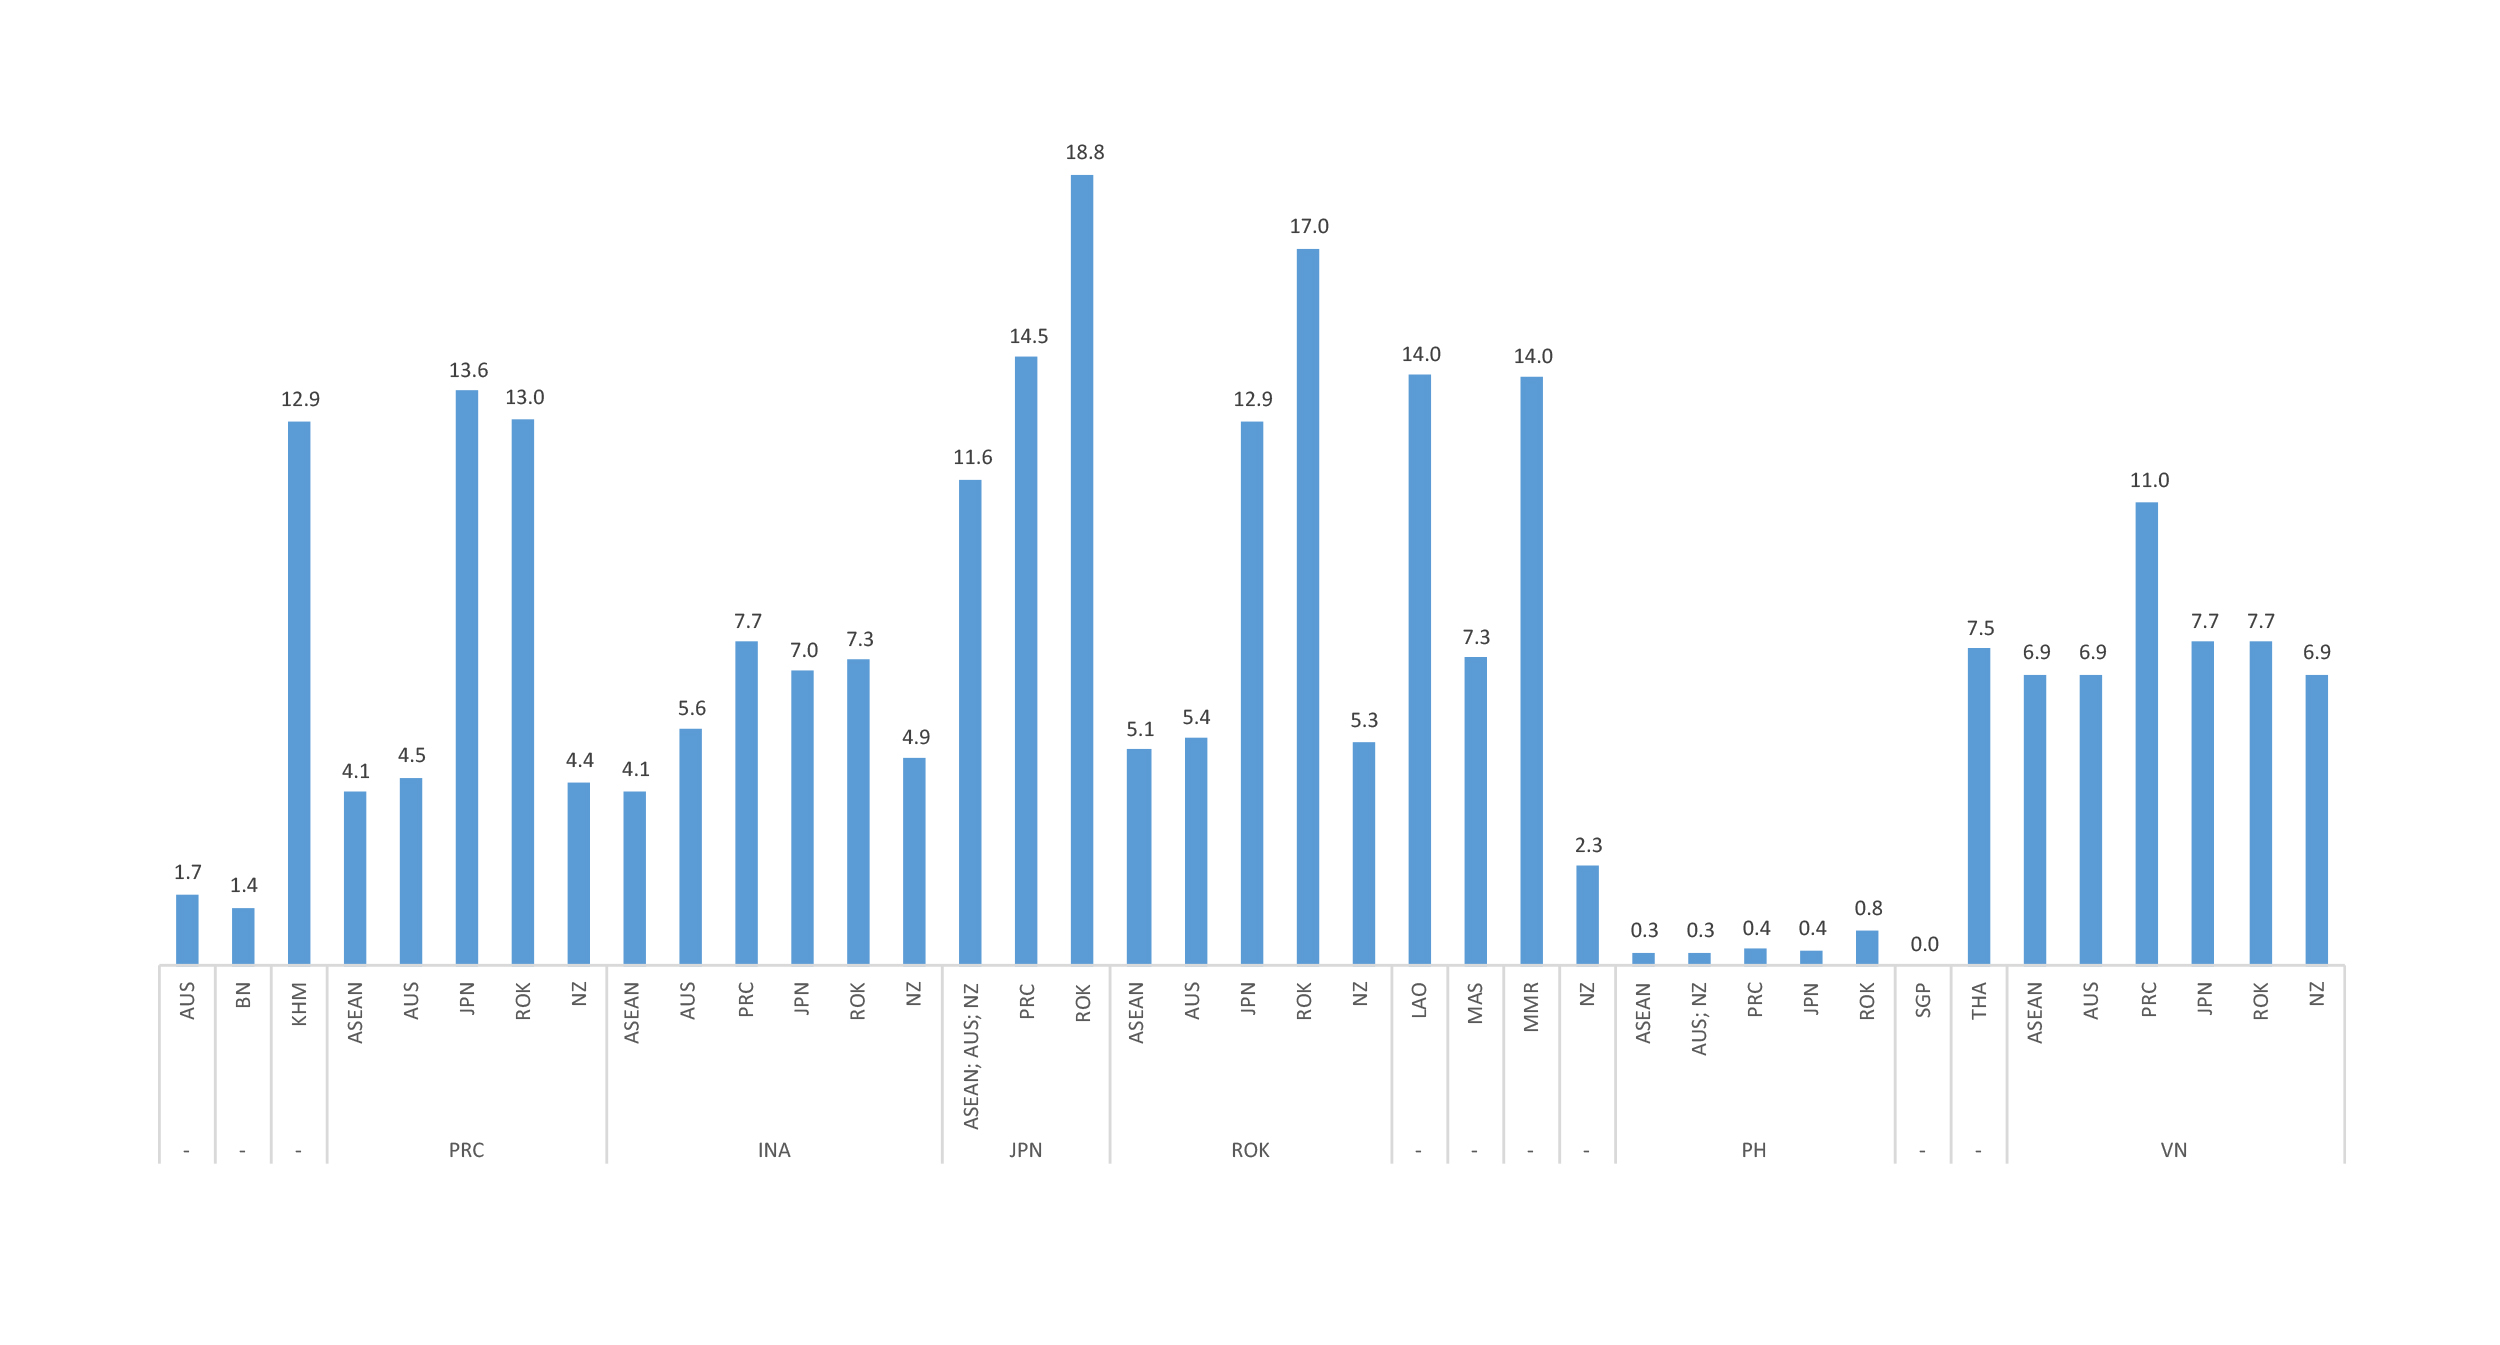
It brings increased market access to a large and regionally significant market. In fact, it increases the number of duty-free tariff lines from 22.9% (at the beginning of RCEP's negotiations) to 63.4% after entering into force in full for all RCEP members. Moreover, 89.7% of total tariff lines would become duty-free upon RCEP's Year-21 - a meaningful liberalization of goods in the region considering the difficulties that RCEP economies had to face, such as the different levels of ambition by RCEP parties and the problems to reach consensus among some of the parties, among others. In addition, RCEP is groundbreaking for agreeing on preferential tariff treatment for important bilateral trade flows that had not been subject to market access benefits of any prior FTA in force. For example, trade flows between China and Korea, as well as Japan and Korea.
In other words, RCEP contributes to improved market access through deepening tariff liberalization commitments from those in existing FTAs among RCEP parties and starting a preferential tariff treatment among RCEP parties with no prior FTA. The effort to liberalize has been significant. Looking at the differences between the base and preferential tariffs in RCEP members provides a glimpse of the extent of the liberalization achieved through RCEP.

Considering that reaching any agreement tends to be more difficult as the number of parties involved goes up, it is not surprising that the RCEP negotiations were challenging. The different development levels among these parties also added an extra level of complexity to the process.
The final agreement involved a deal including multiple tariff liberalization schedules for several parties, as well as a significant number of products with long liberalization periods (26.0% of total tariff lines) or partial liberalization (3.1% of total tariff lines). RCEP negotiations also led to very sensitive products excluded from the liberalization process (7% of total tariff lines). In this sense, RCEP's liberalization process is remarkable but relatively slower compared to other FTAs because 26.0% of its total tariff lines are scheduled for full liberalization only after 10 years or more, which is more compared to, for instance, the CPTPP (5.7%).
At the sectoral level, raw materials or intermediate products (e.g., fertilizers, cork, silk, base metals) would benefit the most since these product groups are among the most fully liberalized upon RCEP's entry into force.
However, an analysis of tariff liberalization schedules shows only part of the tariff liberalization story. In practice, its effectiveness will also depend on other factors, such as product-specific rules of origin, which is out of the scope of this study. It is possible, however, that more restrictive rules of origin in RCEP - in comparison to other FTAs involving RCEP partners - could undermine preferential tariff rates agreed upon in RCEP, as it would make it harder to meet the requirements to qualify for preferential treatment.
Meanwhile, labor-intensive-manufactured, agricultural and intermediate products are the topmost products to be liberalized over a period of 10 years or more. Across all RCEP members, the most frequently cited include preparations of cereals, flour, starch, or milk; preparations of vegetables, fruits, and nuts; soap; articles of leather; cotton; carpets; special woven fabrics; apparel and clothing; footwear; headgear; and feathers and articles thereof.
Partial liberalization has been implemented by RCEP members following different approaches, such as: (1) reducing the ad valorem duty from base rate to a certain point and remains at that level; (2) reducing the ad valorem part of the duty while the non-ad valorem component remains unchanged; and (3) reducing both the ad valorem and the non-ad valorem parts of the duty. Most of these goods are non-agricultural products. In fact, the ratio between non-agricultural and agricultural is quite high at 5.2:1. Examples of non-agricultural products with the highest average ratio of tariff lines subject to partial liberalization include: cotton; man-made staple fibers; knitted or crocheted fabrics; ceramic products; and vehicles other than railway or tramway rolling stock.
Products frequently excluded from the RCEP liberalization process included agricultural products (e.g., dairy produce, eggs, and honey; beverages, spirits, and vinegar), labor-intensive manufactured goods (e.g., footwear), products in strategic sectors (e.g., vehicles other than railway or tramway rolling-stock), and products with negative externalities (e.g., tobacco and manufactured tobacco substitutes).

Both the CPTPP and RCEP are important mega-FTAs showing progress in trade liberalization in the Asia-Pacific region, in comparison to a scenario with none of them being in force. While CPTPP was driven by individual economies seeking to achieve an FTA with high standards and comprehensive market access; the RCEP negotiations were institutionally driven by ASEAN to facilitate the participation of larger partner economies.
The differences in the nature of CPTPP and RCEP have influenced the depth of their tariff liberalization schedules. For instance, at the date of entry into force, RCEP parties agreed to fully liberalize 63.4% of total tariff lines, compared to the CPTPP parties that agreed the full liberalization of 86.1% of the tariff lines. In addition, the starting points for both negotiation processes were different. While 54.1% of tariff lines in CPTPP already had a base tariff equal to 0%, only 22.9% of the tariff lines in RCEP had duty-free base tariffs.
Another key difference is that RCEP has no explicit staging categories, and it does not fully liberalize any single Harmonized System (HS) chapter upon entry into force - unlike the CPTPP which immediately liberalized 10 HS chapters across all its members. Moreover, the maximum period granted to reduce preferential tariff rates to the duty-free level is longer in RCEP than in the CPTPP.
In addition, RCEP members included a larger percentage of their tariff lines subject to liberalization periods of 10 years or more (26%), as compared with the CPTPP's 5.7%. In fact, 30 out of 39 RCEP liberalization schedules had more than 19.6% of their total tariff lines under longer liberalization periods. Incidentally, the CPTPP's highest percentage was from Mexico's schedule, at 19.6%. RCEP also has considerably more goods under partial liberalization and exclusion compared to the CPTPP.
Finally, economies in the CPTPP and in RCEP differ on which product group they consider more sensitive. This is closely related to the productive structures of their economies. In the CPTPP, most of the exclusions and products under partial liberalization were agricultural, whereas in RCEP more were non-agricultural products.
Despite these differences, both agreements are remarkable as they will fully liberalize a significant percentage of tariff lines. In the long term, 98.9% of the tariff lines will eventually be fully liberalized under CPTPP, while 89.7% of the RCEP tariff lines will enjoy full liberalization after 21 years.
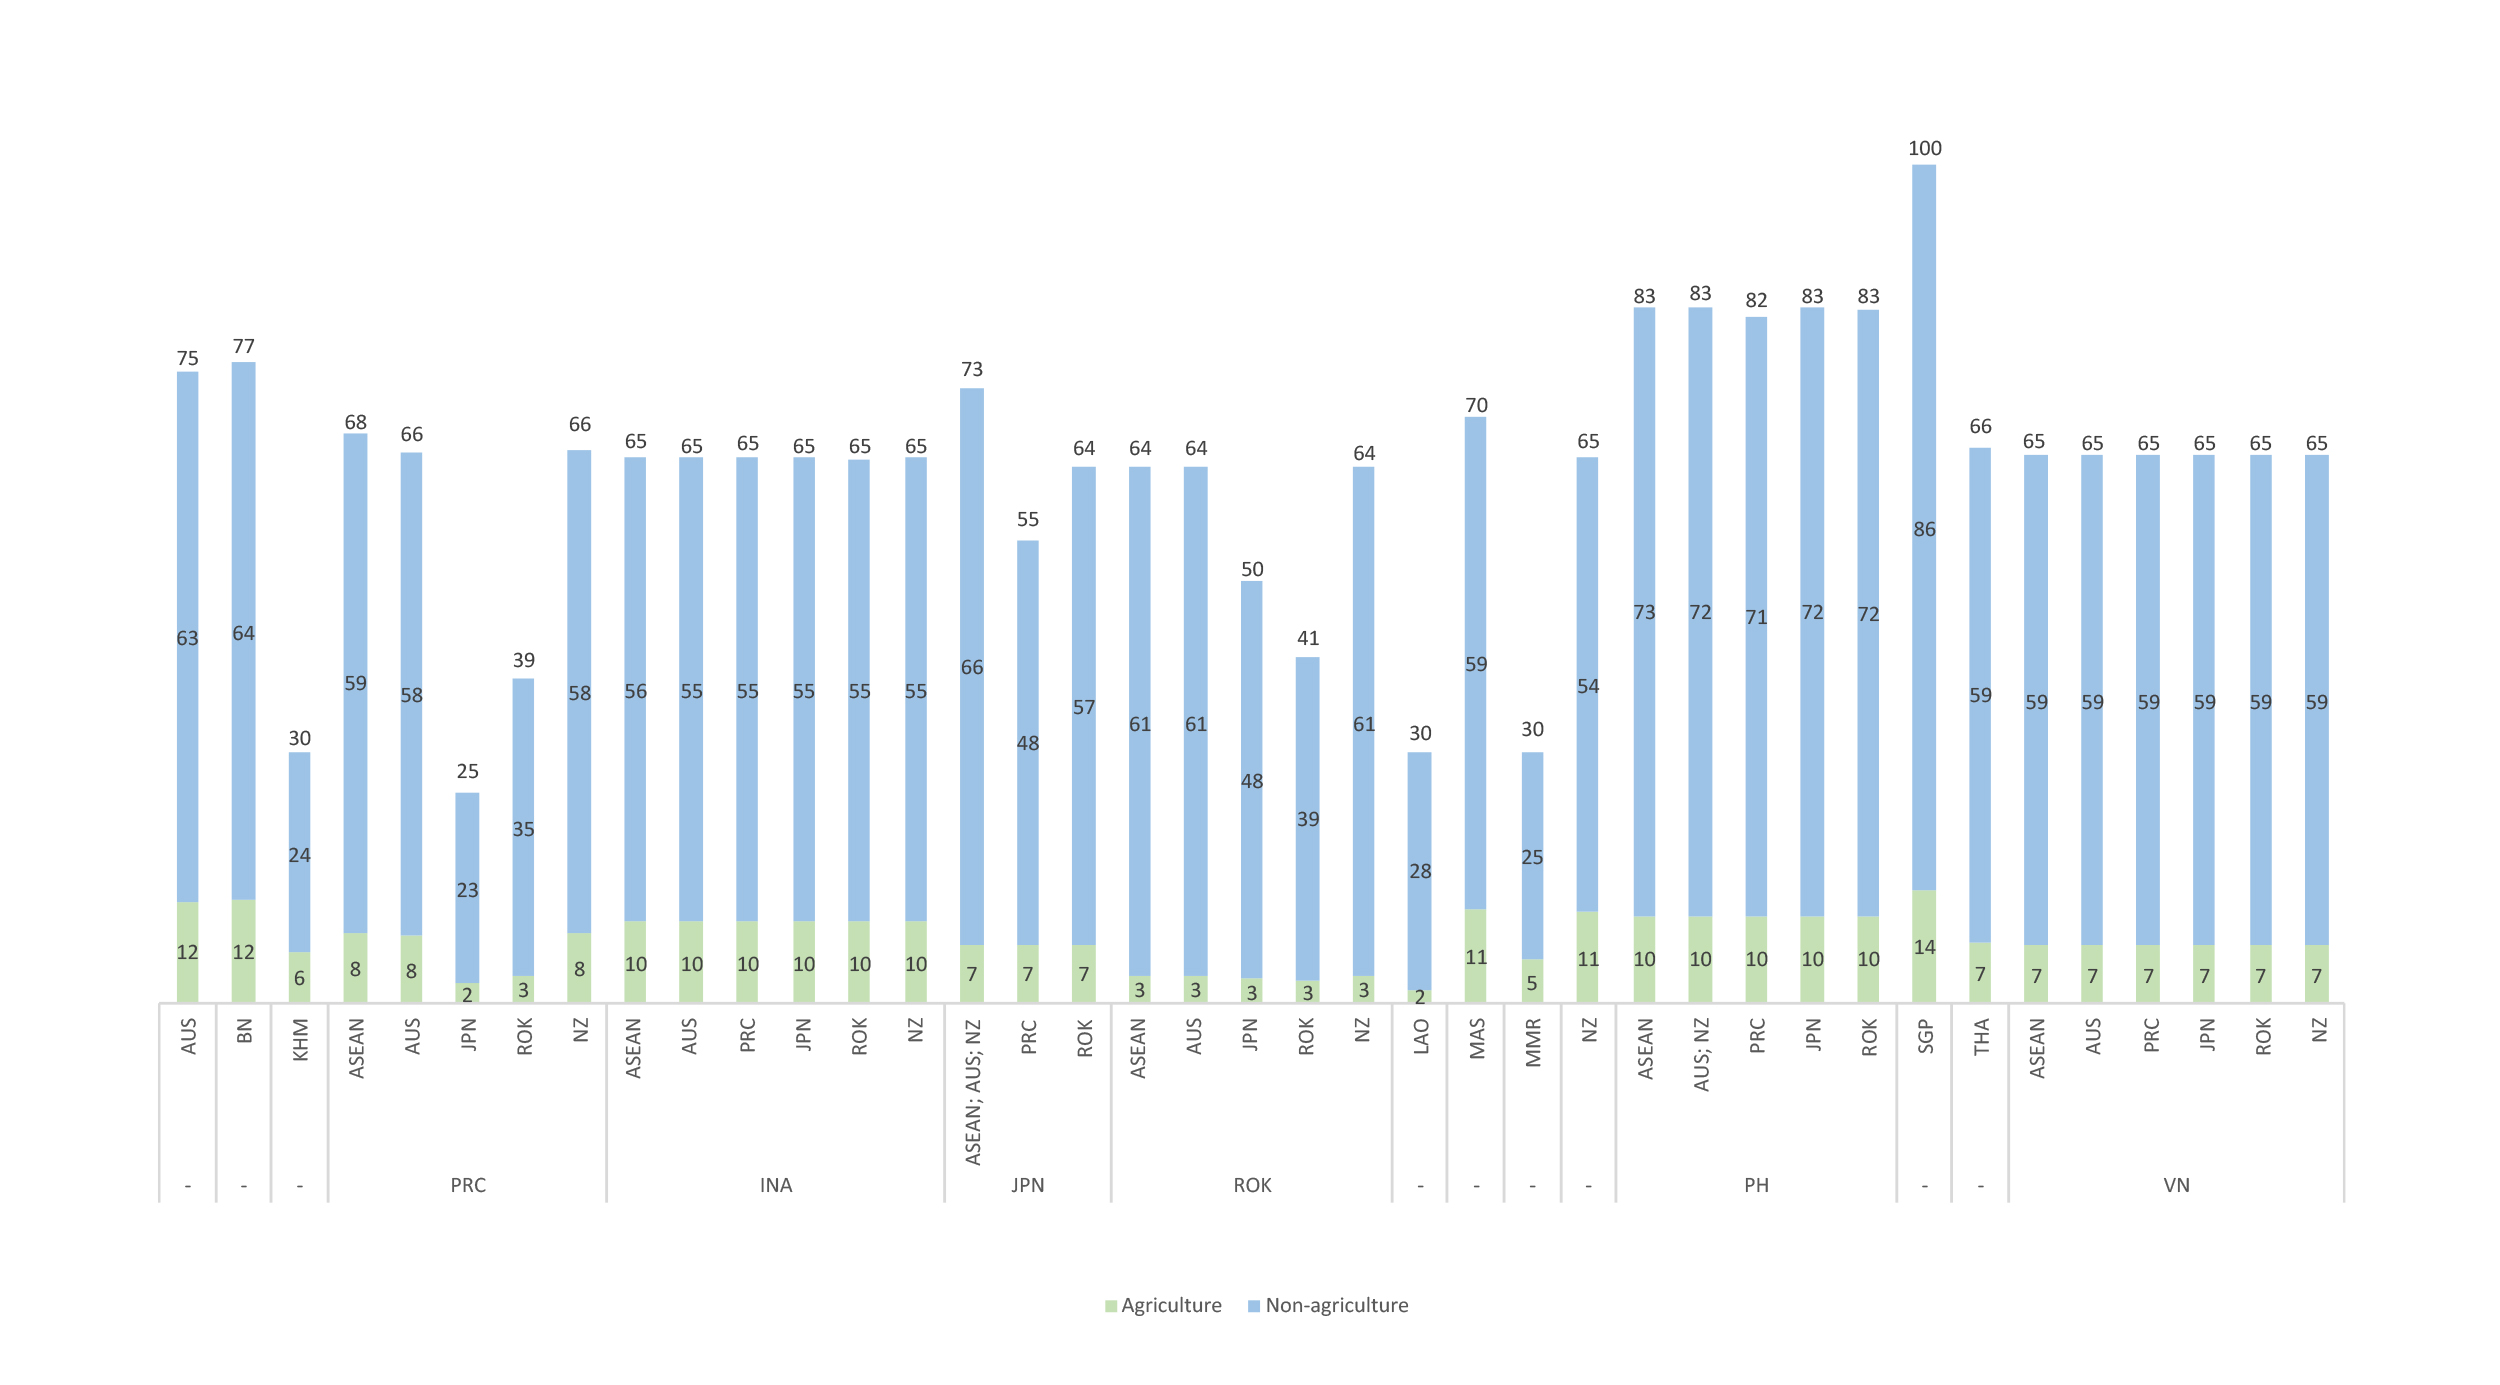
Source: RCEP legal text, Annex I; APEC Policy Support Unit (PSU) calculations.
Note: AUS (Australia); BD (Brunei Darussalam); KHM (Cambodia); PRC (China); INA (Indonesia); JPN (Japan); ROK (Korea); LAO (Lao PDR); MAS (Malaysia); MMR (Myanmar); NZ (New Zealand); PH (the Philippines); SGP (Singapore); THA (Thailand); VN (Viet Nam).
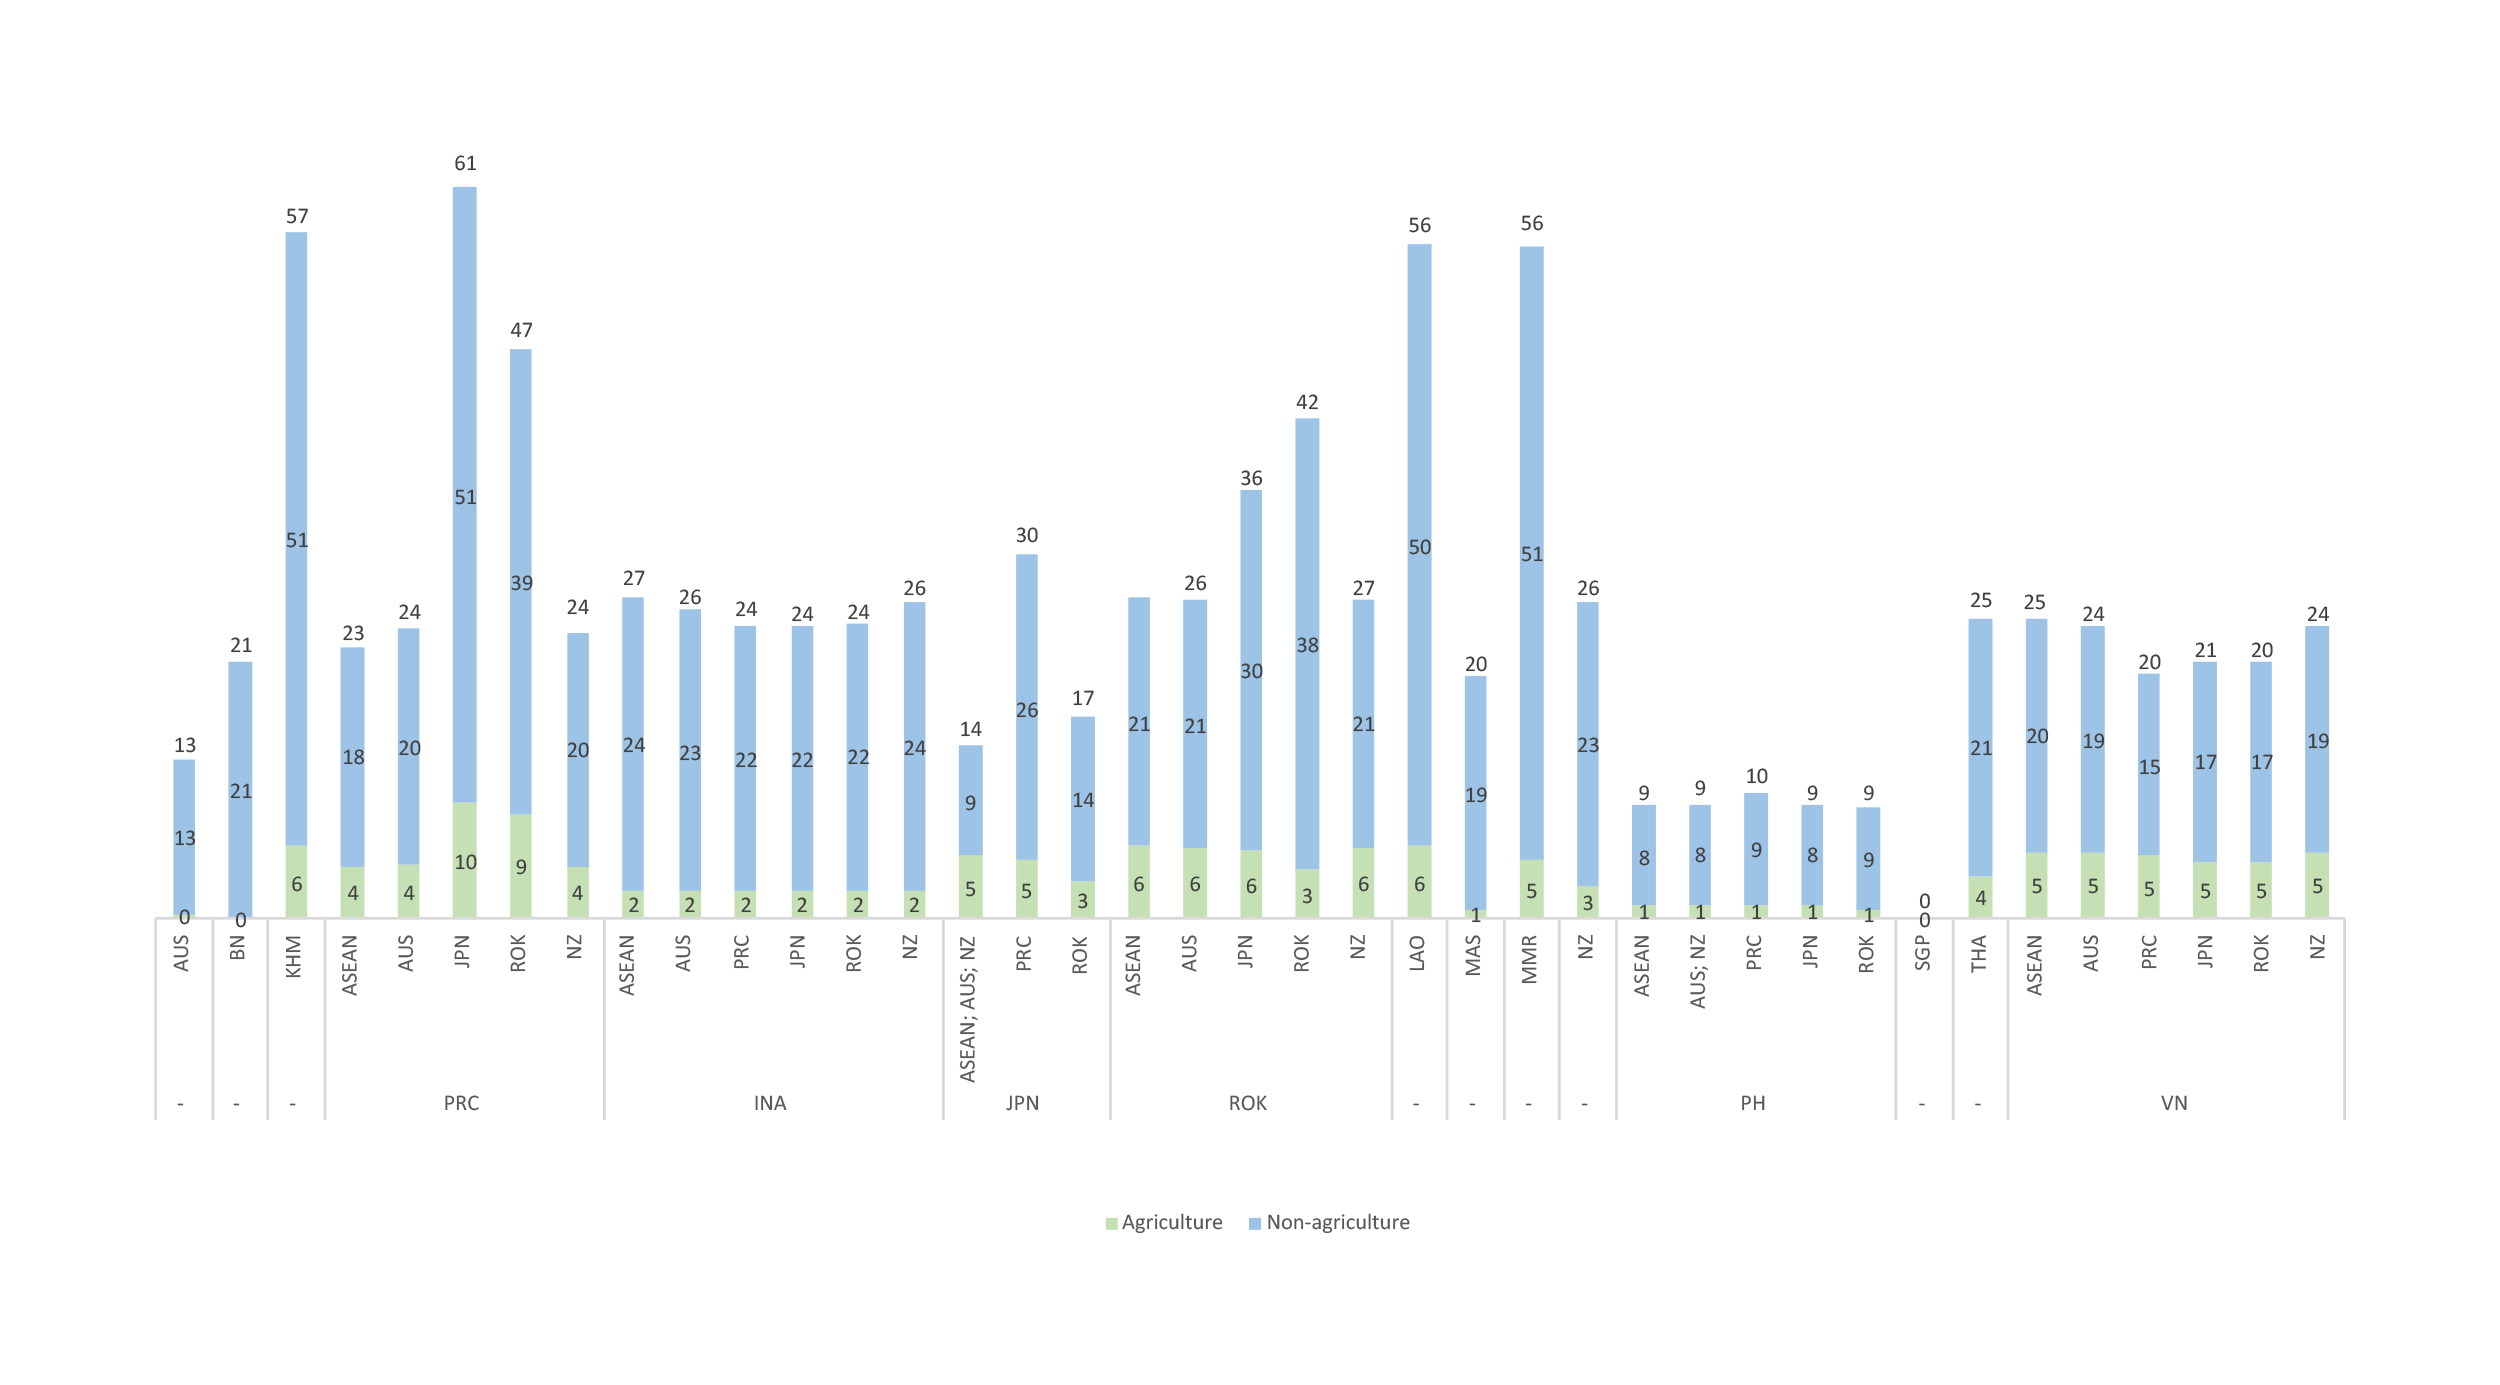
Some of the key observations of the analysis of the RCEP tariff liberalization commitments are as follows:
RCEP's meaningful tariff liberalization is one reason that makes it a step forward for APEC to realize the much larger FTAAP. Both the CPTPP and RCEP are important pathways for this goal because they provide increased market access and greater economic integration across the region, strengthen economic links among their members and represent important instruments to build up trust among economies. RCEP is arguably the largest regional FTA in history, with its members accounting for 30.0% of global population, 30.0% of global GDP, and 28.8% of global trade. It is expected to create enormous potential for trade as it includes important trade flows that had not benefitted from preferential trade liberalization via previous RTAs/FTAs. The envisioned FTAAP will integrate trade among the 21 member economies of APEC and, thus far, RCEP has already increased the link among 12 of them, while the CPTPP has linked 11. These two agreements collectively demonstrate the region's commitment to liberalizing trade and creating fertile ground for greater regional integration towards an eventual FTAAP.
RCEP's negotiation process faced numerous challenges, primarily because of the number of parties involved, with differences in their levels of development and outcome ambition. To accommodate the needs of all RCEP members, ambitions were kept reasonable through exclusions, goods put under partial liberalization, and long liberalization periods. Creative solutions were also written into RCEP to address specific concerns, such as the multiple liberalization schedules, which could be more costly to manage. In fact, 30 out of 39 RCEP tariff liberalization schedules included more than 19.6% of their tariff lines, set to achieve full liberalization status in 10 years or more. This could imply, for some parties, slower liberalization in RCEP than in other RTAs/FTAs.
The degree of trade liberalization agreed upon in RCEP is still remarkable, since 63.4% of total tariff lines will enjoy a duty-free status upon RCEP's entry into force, and a total of 338,395 tariff lines or 89.7% of total tariff lines, would become fully liberalized under RCEP by Year-21-a meaningful percentage considering the collective size and value of RCEP members.
Interestingly, RCEP appeared to be more sensitive towards non-agricultural products if compared to the CPTPP, which was more sensitive to agricultural products. A comparison of these FTAs revealed that 72.5% of tariff lines under partial liberalization and exclusion in RCEP were non-agricultural products.
Some categories of goods in RCEP are being liberalized relatively quickly. Capital goods (e.g., machinery), intermediate goods (e.g., chemicals), and raw materials (e.g., nickel) will experience faster liberalization, whereas labor-intensive products (e.g., textiles and wearing apparel), agricultural goods, and vehicles will face slower liberalization or even partial liberalization and exclusions.

Senior Analyst from the APEC Policy Support Unit.
Researcher from the APEC Policy Support Unit.
Researcher from the APEC Policy Support Unit.